For Portfolio Investors
Know exactly what your portfolio is worth in real time.
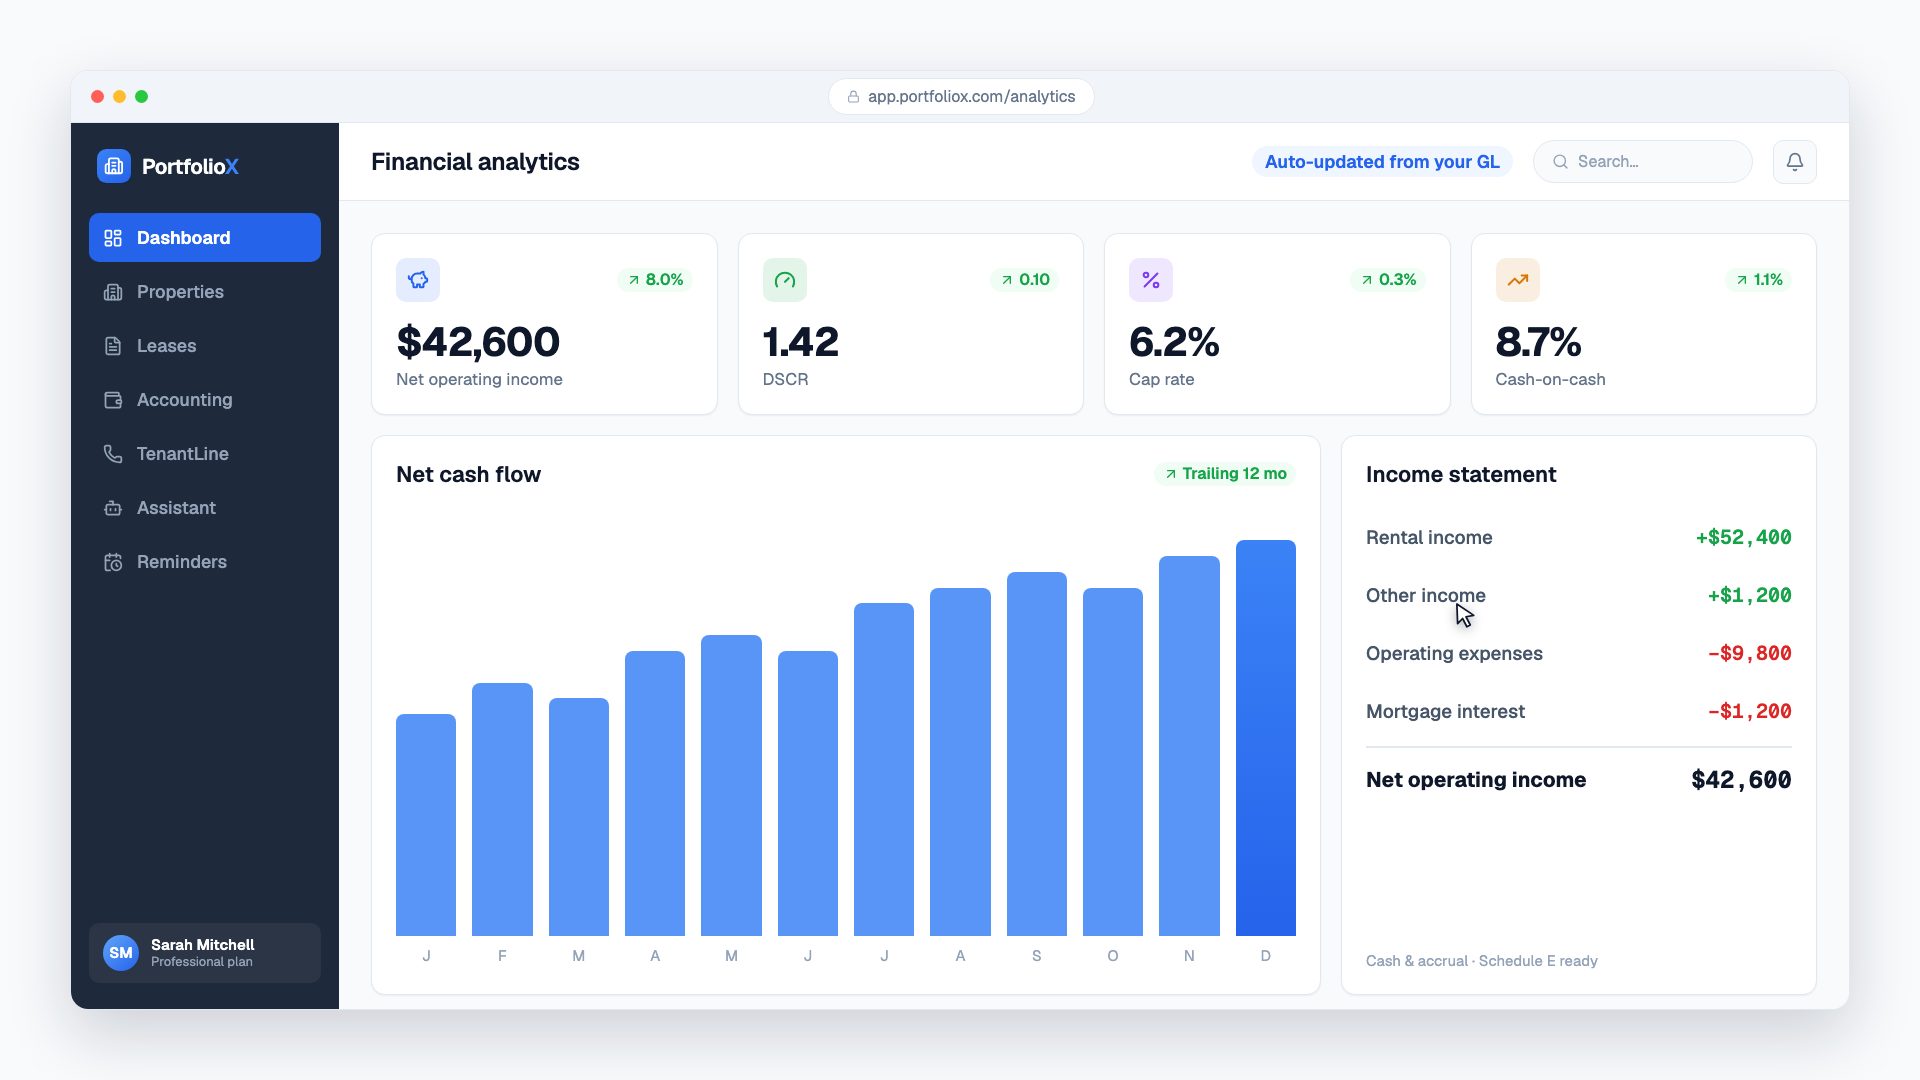
Financial clarity across every property in your portfolio. NOI, cap rate, cash flow, and mortgage equity — all calculated and updated automatically.
The investor's problem
Your portfolio is growing, but your tools aren't keeping up.
Can't see aggregate portfolio performance
Your properties are tracked in different spreadsheets, bank accounts, and tax documents. Getting a portfolio-level view requires hours of manual consolidation every month.
No easy way to compare property-level returns
Which property has the best cap rate? Which one is dragging down your portfolio? Without standardized metrics across all properties, you're making decisions on gut feeling.
Spending hours each month on manual calculations
Every month you're pulling bank statements, matching transactions, updating spreadsheets, and running formulas. Time you could spend finding your next deal.
The metrics that matter, calculated automatically
Every number an investor needs — per property and across your entire portfolio.
NOI
Net Operating Income
Revenue minus operating expenses per property
DSCR
Debt Service Coverage
NOI divided by total debt service
Cap Rate
Capitalization Rate
NOI as a percentage of property value
CoC
Cash-on-Cash Return
Annual cash flow vs total cash invested
Per-Property P&L
Income, expenses, and net profit broken down for every property
Portfolio Summary
Aggregate metrics across your entire portfolio in one view
Comparison Analysis
Side-by-side performance comparison to identify top performers
Portfolio Dashboard
Aggregate view across all properties with real-time metrics
See your entire portfolio on one screen. Total income, total expenses, vacancy rates, and key performance metrics updated in real time. Drill into any property for a detailed breakdown.
- Portfolio-wide income and expense summaries
- Property-by-property performance comparison
- Real-time vacancy and occupancy tracking
Mortgage Amortization
Full schedules, principal vs interest, equity tracking
Every mortgage in your portfolio gets a complete amortization schedule. See exactly how much goes to principal vs interest each month, track your equity position, and plan refinancing opportunities.
- Complete amortization schedules per property
- Principal vs interest breakdown
- Equity position tracking over time
Online Rent Collection
Secure payment processing, automatic reconciliation, ACH support
Tenants pay through a secure portal via credit card or ACH. Payments are automatically matched to leases and tracked against expected income. No more chasing checks or reconciling bank deposits.
- Secure online payment processing
- Automatic payment matching and reconciliation
- ACH and credit card support
Team Collaboration
Invite partners and accountants with role-based access
Give your business partners read-only access to review performance. Let your accountant pull financial reports directly. Everyone sees what they need — nothing more.
- Role-based access: Owner, Admin, Member, Viewer
- Invite partners, accountants, and property managers
- Organization-level data isolation
PropertyCam
Document property conditions across your portfolio
PropertyCam gives you a visual audit trail across every property. GPS-stamped photos, room-by-room inspections, and condition tracking help protect your investment and streamline insurance claims.
- Condition tracking across your entire portfolio
- Insurance-ready documentation with GPS verification
- Professional PDF reports for each inspection
- Before/after comparison for renovations and tenant turnover
GL Accounting & Bank Feeds
Real double-entry bookkeeping with Plaid bank sync
Stop bolting QuickBooks onto your portfolio. PortfolioX has a true double-entry GL with 60+ chart of accounts, Plaid bank feeds with AI categorization, and automatic journal hooks from rent and mortgages — purpose-built for rental real estate.
- Plaid bank connections with AI auto-matching
- Schedule E export, depreciation, and period closing
- Consolidated statements across the entire portfolio
- Daily Stripe reconciliation including delayed ACH
AI Manager Assistant
Drafts comms, queries your portfolio, and takes action
A plan-aware AI assistant grounded in your live portfolio data. Ask “which properties are below 1.0 DSCR?” or “draft a renewal letter for Lincoln Ave” — and the assistant pulls real numbers, drafts the message, and queues it for your approval.
- Manager Assistant for portfolio queries and drafting
- AI Maintenance Triage routes requests automatically
- TenantLine AI answers tenant calls 24/7
- AI Report Generator for executive narratives
Native Mobile App
Manage your portfolio from your phone
100+ screens of native iOS and Android tooling. Approve work orders, review GL transactions, capture photos, run inspections, and chat with the AI assistant — all from the field with offline support.
- 100+ screens with full feature parity to web
- Push notifications for payments and approvals
- Offline caching for inspections in the field
- Mobile Stripe payments & document signing
The ROI of switching to PortfolioX
Here's what investors typically see after the first month.
Plans built for investors
Most investors start with Professional. Growing fast? Enterprise has no limits.
Professional
For serious investors managing multiple properties.
10 properties, 3 users, 40 tenants, 25 GB
- GL accounting + Plaid banking sync
- Schedule E + depreciation + period closing
- AI Manager Assistant + TenantLine AI
- Inspections, annotations & PDF reports
- eSignatures & document uploads
- Custom branding & all reminders